I decided to communicate this exploration of blogging site WordPress (kind of meta!) via a Piktochart report format. I wanted to think about WordPress as an ICT for youth because my nephew informed me that he uses WordPress in school. I’ll admit I was surprised and very intrigued.
The infographic-like report lends itself to brevity, but I would add that my challenges with WordPress at first were in learning the various options it offers. For example, the first time I used it I needed to produce text within a certain word count, so I typed in Microsoft Word and then pasted into a WordPress post. As soon as I did that, I noticed the word count at the bottom of the screen! Other “challenges” were simply attempts to learn how to edit beyond the text: adding hyperlinks, editing images, figuring out how to caption images, and distinguishing between tags and categories. I also had to look up pingbacks and tagbacks, since I had no idea what they were.
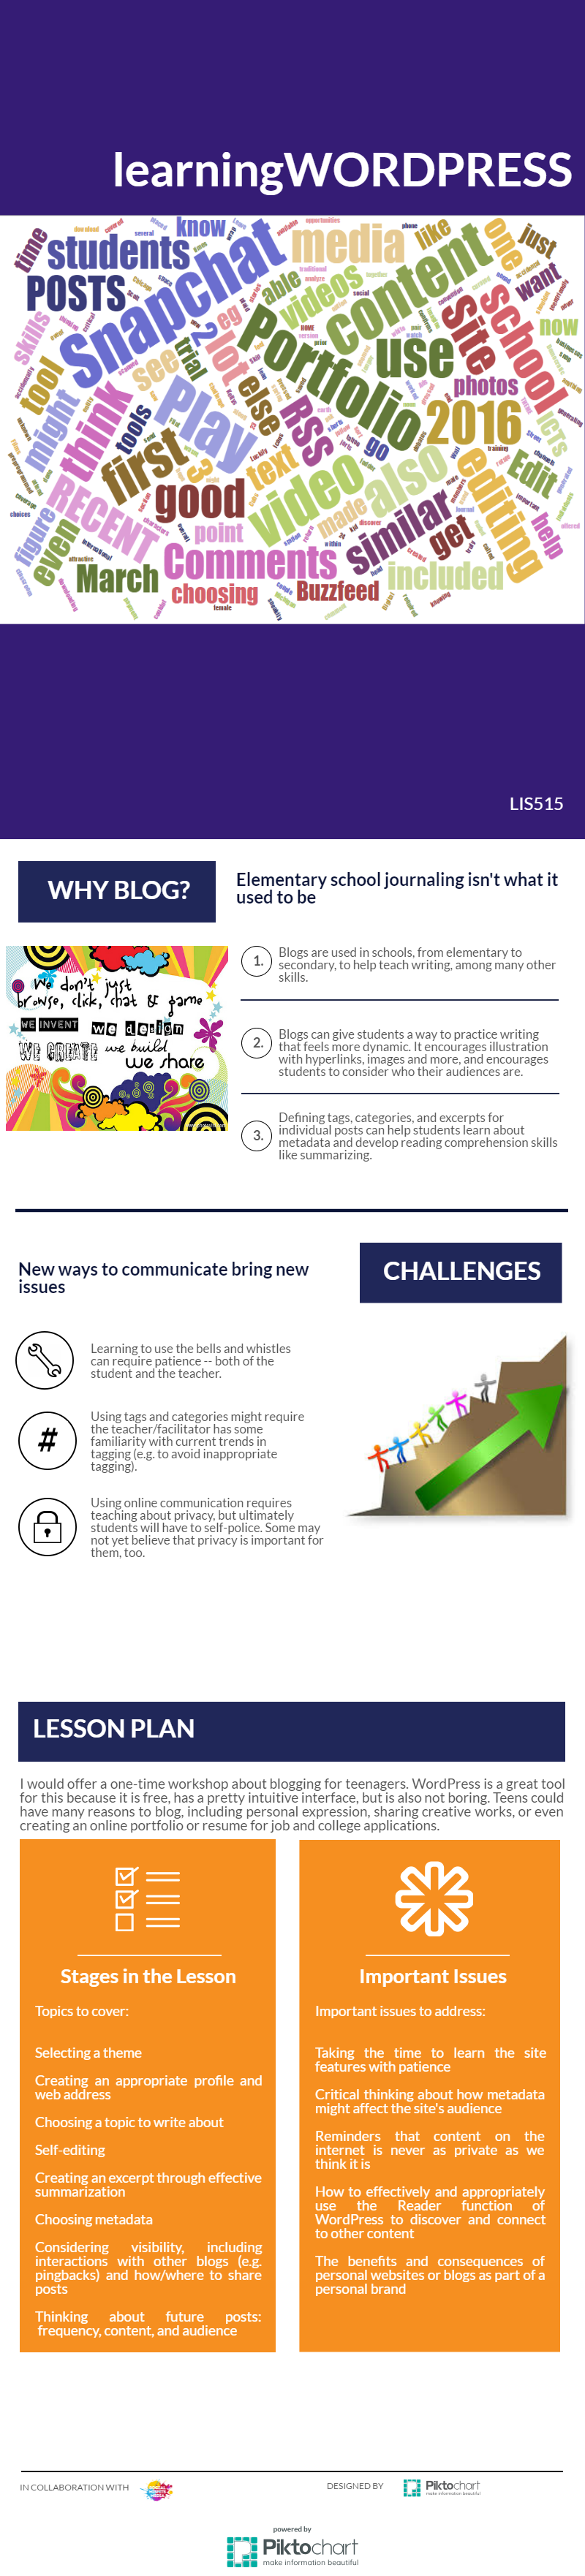
The word cloud included in the report graphic below was created with all of the posts I had posted on WordPress to date.